

ADLOGGS REAL-TIME ANALYTICS · DELIVERY INTELLIGENCE Real-time delivery analytics
for every order, rider and partner.
One live dashboard for orders, riders and delivery partners: on-time rate, cost per order, partner scores and service availability by outlet, zone and hour, not in a report you read tomorrow morning.
- Live KPIs across every fleet
- 3PL partner performance scoring
- Service availability by location
- Trend and peak-demand alerts
- 30,000+
- daily transactions
- 60+
- Indian cities
- Web + apps
- Android and iOS
- Orders today
- 1,284
- On-time rate
- 94.2%
- Avg delivery
- 27 min
- Riders active
- 86
Orders per hour Today
- 99:00, 38 orders
- 1010:00, 52 orders
- 1111:00, 61 orders
- 1212:00, 94 orders
- 11:00, 118 orders
- 22:00, 86 orders
- 33:00, 57 orders
- 44:00, 49 orders
- 55:00, 63 orders
- 66:00, 92 orders
- 77:00, 124 orders
- 88:00, 70 orders
Partner score This hour
- Own riders95▲
- Partner A92▲
- Partner B87▼
- Partner C79▲
Underperforming in Zone 3
Peak forecastDinner volume rising in Zone 4 from 7 pm
IN GOOD COMPANY. CONNECTED THROUGH ADLOGGS.


01 / WHAT REAL-TIME ANALYTICS COVERS
Four live views.
One delivery dashboard.
Real-time delivery analytics is a live view of delivery performance built from order, rider and partner data as it happens, rather than from end-of-day reports. Adloggs real-time analytics shows on-time rate, delivery times, cost per order, cancellations, 3PL partner scores and service availability, cut by outlet, zone, partner, rider and hour.
- 01 / PERFORMANCE
Delivery performance, live
On-time rate, delivery times, SLA metrics and delays for every active and completed order, across your own riders and 3PL partners.
Adloggs DMS - 02 / PARTNERS
Dynamic 3PL partner scoring
Every 3PL partner rated in real time: efficiency benchmarked, underperformance flagged, and the best partner recommended for each order.
AI 3PL allocation - 03 / TRENDS
Predictive trend analysis
Order volumes, delivery speed and cancellation rates over time, with peak periods and likely bottlenecks flagged before they hit.
How LoggiAI predicts - 04 / AVAILABILITY
Service availability monitoring
Rider and 3PL availability around each location is checked continuously, and your systems can query it through the service availability API.
API documentation
Cut every number by
- Outlet or store
- Zone & cluster
- Delivery partner
- Rider
- Hour of day
- City
- Client
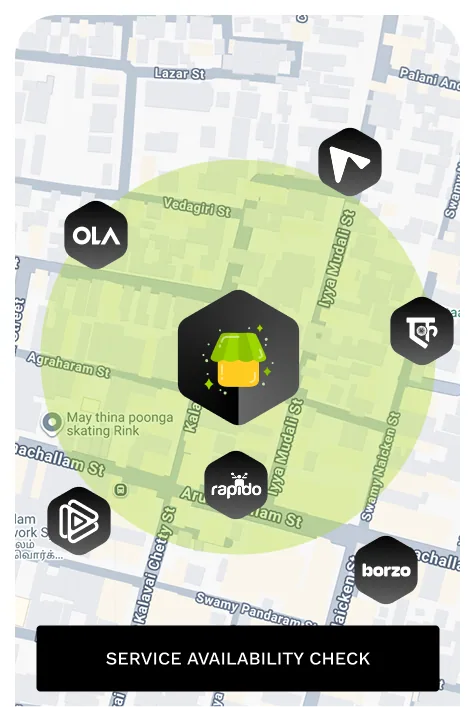
Service availability check
Before an order is promised, Adloggs checks who can actually deliver it: the riders and 3PL partners around the location are scanned and a qualified one is assigned, so orders don't sit waiting for capacity.
- Nearby riders and 3PL partners are scanned for each order's location.
- Qualified partners are assigned so orders are not left waiting for capacity.
- The same check is in the REST API as the service availability endpoint, for your app or website.
- Every partner in range is visible on the map, alongside your own riders.
02 / DELIVERY METRICS, DEFINED
The numbers that run
last-mile delivery in India.
Plain definitions of the delivery KPIs Adloggs reports, so operations, finance and leadership read the same numbers the same way, from one outlet to every city.
- 01On-time delivery rate
- Share of orders delivered within the promised time (the SLA). The headline measure of delivery reliability.
- 02Average delivery time
- Minutes from order placement to delivery, tracked per outlet, zone and hour.
- 03Cost per order
- Delivery cost divided by orders delivered. Compared by partner, zone and hour, it shows where volume is cheapest to serve.
- 04SLA breach rate
- Share of orders that missed the promised time: the flip side of on-time rate, and the starting point for root cause analysis.
- 05Cancellation rate
- Share of orders cancelled before delivery, whether by the customer, the store or for lack of a rider.
- 063PL partner score
- A rating of each delivery partner's live performance, used to benchmark partners and choose the best one per order.
- 07Order handling time
- Time from order placement to handover to a rider: the part of delivery time the outlet controls.
- 08Service availability
- Whether a rider or delivery partner can serve a location right now, checked before the order is promised.
One dashboard, every role
- Operations head
The whole network
On-time rate, cost per order and partner scores compared across cities, clients and fleets.
- City or cluster manager
Zones and hours
Where delays build up during the day, and which partners to shift volume to.
Shift volume by cluster - Outlet or store manager
One outlet
Handling times and delivery times for a single outlet, so preparation issues show up early.
- Fleet and rider lead
Every rider
Rider scorecards and performance analytics, with rider management in the same platform.
Rider management
 KFC”
The service quality has been consistently reliable, ensuring smooth and timely deliveries across all our operations.
 Wellness Forever”
Exceptional customer experience backed by sleek, intuitive tech—our orders deliver with lightning speed every time.
 Ample Foods (Meatigo)”
Adloggs leverages a large network of hyperlocal partners, providing Meatigo with essential flexibility and scalability to handle time-sensitive deliveries across various regions.
03 / QUESTIONS, ANSWERED
Delivery analytics,
answered.
Last updated
What is real-time delivery analytics?
Real-time delivery analytics is a live view of delivery performance built from order, rider and partner data as it happens, rather than from end-of-day reports. It shows measures such as on-time rate, delivery times, cost per order, cancellations and partner performance while there is still time to act on them.
Which delivery metrics does Adloggs track?
Adloggs reports on-time rate, delivery times, SLA metrics and delays, cost per order, order volumes, cancellation rates, order handling times, 3PL partner scores, rider performance and service availability. Each can be cut by outlet, zone, partner, rider, hour, city and client.
How does Adloggs score 3PL delivery partners?
Each connected 3PL partner is rated in real time on its delivery performance. Efficiency is benchmarked across partners, underperformance is flagged, and the best partner is recommended for each order. LoggiAI uses the same scores when it allocates orders.
What is a service availability check?
A service availability check confirms whether a rider or delivery partner can serve a location at that moment. Adloggs scans nearby riders and 3PL partners for each order and assigns a qualified one, and the same check is available to your systems through the service availability endpoint of the REST API.
Can I see delivery analytics by outlet, zone, partner and hour?
Yes. Every number can be broken down by outlet or store, zone and cluster, delivery partner, rider, hour of day, city and client, which is how you see where delays and costs actually come from.
Does Adloggs track rider performance?
Yes. Rider scorecards and performance analytics sit alongside rider management (onboarding, shifts, wages, incentives and compliance), so managing riders and measuring them happen in one platform.
How is real-time analytics different from root cause analysis?
Real-time analytics shows what is happening now. Root cause analysis explains why a delivery went wrong and whether the cause repeats. They use the same live data: analytics spots the dip, root cause analysis traces it.
Does real-time analytics work across Indian cities?
Yes. The same live dashboard covers every city you deliver in, from one outlet to all 60+ Indian cities where Adloggs runs hyperlocal and last-mile delivery, with your own riders and Indian delivery partners such as Shadowfax, Porter, Borzo, Rapido and Delhivery.
How do I choose delivery analytics software in India?
Look for live data rather than next-day reports; every metric cut by outlet, zone, partner, rider and hour; 3PL partner scores next to your own riders; a service availability check your app can call; and support for how India delivers: cash on delivery, several delivery partners and hyperlocal zones in every city. Adloggs covers all of these.
Can delivery data flow into our own systems?
Yes. Order status updates flow back to your systems by webhook, and the REST API covers order creation and cancellation, tracking and service availability.
DECIDE ON LIVE DATA
See your numbers
as they happen.
Book a demo and we'll show the live dashboard on delivery scenarios like yours, or create an account and get started.
- 01Book a demo
Tell us which numbers matter most: on-time rate, cost per order, partner performance or availability.
- 02Connect
Orders flow in from your POS, OMS, e-commerce platform or the REST API, with your riders and delivery partners.
- 03Watch it live
Dashboards fill as orders run through Adloggs, by outlet, zone, partner and hour.